Nuclear and renewable resources
Uranium Performance in 2024 and Outlook 2025Uranium Performance 2024
2024 was a year of mixed performance in the uranium market. Long-Term (LT) contract prices – the pricing structure that essentially dictates the financial health of uranium production companies – increased by +16% (from $68/lb. to $79.00/lb.). Long term conversion, the process to convert uranium ore (U3O8) to UF6, soared by +43% ($35.00/kgU to $50.00/kgU). Long Term enrichment, denoted by Separative Work Units (SWU) prices climbed by +10% ($151.00/SWU to $166/SWU). In contrast, the spot uranium price declined from $91.00/lb. as of 2023 year-end to $73.00/lb. on December 31, 2024 – a loss of -$18.00/lb. (-19.8%). Uranium stock investors took their “price signal” sentiment from the spot uranium price, which is a thinly traded market among a handful of traders that accounts for a small percentage of utilities' needs. A better measure to gauge the viability of the uranium market is the long-term contract price, which has marched higher throughout the year. The reported LT contracting in 2024 came in about 105M lbs., vs. a yearly consumption rate of around 190M lbs. This means LT contracting provided 85M lbs. less than the replacement rate of 190M lbs. Western utilities appear to be delaying paying the necessary price increase to increase uranium production. This has resulted in a very quiet physical market, where utility buyers are not buying, and producers are not selling--—basically a standoff between the producers and the utilities. This has contributed to a decrease in investor sentiment and a lack luster performance in the uranium market especially in Q4.
While long-term contracting was robust in 4Q 2024 following a very slow first nine months of the year, the 2024 total still came in at only 106.2 lbs. against yearly consumption of ~190M lbs., resulting in a greater than 85M lb. shortfall. The historic uranium price rise of Q4 ‘23 into early Q1 ’24 (from $71/lb. in September 2023 to as high as $106/lb. in January 2024), and the uncertainties around the US Russian uranium import ban , combined with the Russian ban on exported enriched uranium into the U.S. , were major contributors to a rather quiet LT contracting in 2004.
The lack of physical buying in the uranium market was the major factor driving the spot uranium price to decline about 20% in 2024. This decline occurred even though the long-term price continued to march higher throughout the year. A decline in the uranium sector was not unexpected, considering that the spot price of uranium gained about 100% from February 2023 to a peak of $106 in January 2024. So, the recent 20% pull back to the current $74/lb. spot price would be considered a normal healthy correction.
Despite the slow physical market and the lack of replacement uranium purchasing, , the uranium market remains fundamentally strong, and the outlook for increased uranium prices is positive for 2025. There are several factors which support this, as shown below:
Uranium Demand Drivers for 2025
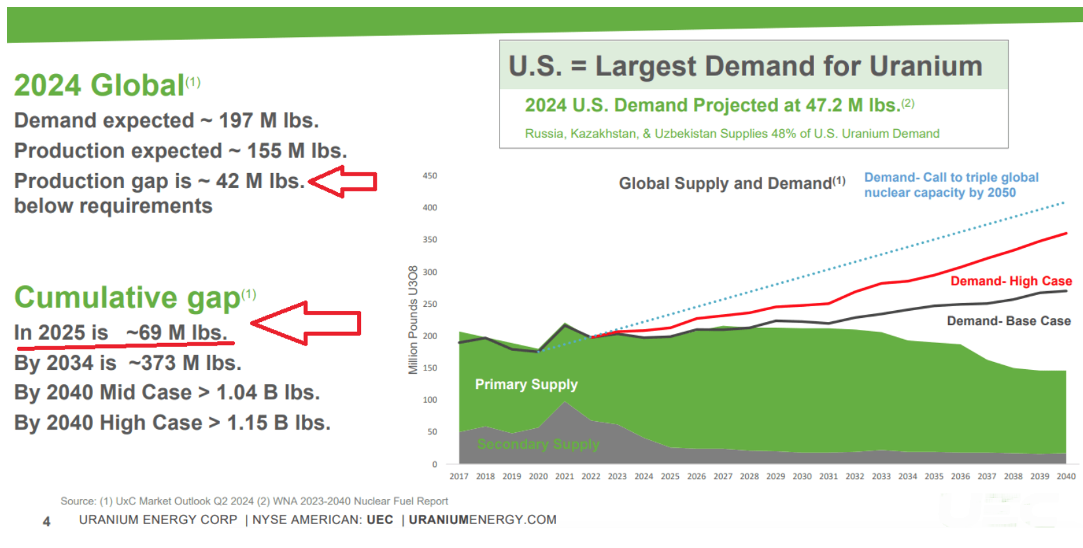
- Uranium supply/demand deficit. We have known for some time that the uranium market is in a structural supply/demand deficit, and will remain so for several years. This cumulative global deficit will be 42M lbs. in 2024 and a projected 69M lbs. in 2025, and will expand to more than 1B lbs. by 2040, according to UxC, a leading uranium price publisher. This deficit is driven by the increasing demand for uranium, which is expected to nearly double by 2040 due to the expansion of nuclear power capacity to achieve zero-carbon targets. The supply/demand gap is shown in the graphic from UxC below.
- Increasing global policy changes on nuclear power. Countries around the world turning towards or reversing prior policies towards nuclear power: U.K., Italy, Japan, India, South Korea, U.A.E., Saudi Arabia, the Philippines, Romania, Poland, just to name a few.
- Nuclear Plant Life Extension. Plant Life Extensions are occurring routinely, especially in the U.S. These life extensions are extending the operating of life of a reactor to 60, 80. And even 100 years in some cases.
- Nuclear Plant Restarts. There are three examples of this trend: 1) Three Mile Island (PA), 2) Palisades (MI) (which has now finalized its $1.5B federal loan to support this restart), and now 3) NextEra is considering resuming operations at the shuttered Duane Arnold nuclear station (Iowa). This is a good sign that increasing emphasis on nuclear power is growing.
- A.I. Data Center growth. Ai data centers could consume 9% of U.S. electricity generation by 2030 (EPRI study) Nuclear power output is set to break global records in 2025, and with recent developments, this kind of growth will likely continue for years. Nuclear power output will increase by around 3% both this year and next, reaching 2,915 TWh. Data Centers used 15 TWh of power in 2023 and will triple in 2024. Wells Fargo sees a 550% increase by 2026 and another 1,150% by 2030. Nuclear stands to benefit immensely from this power growth.
- Increased support for nuclear by US government. The US Department of Energy came out with an update on October 7, 2024 to its "Advanced Nuclear Commercialization Liftoff" report on Monday of the past week. The report mentions that US nuclear capacity has the potential to triple from ~100 GW in 2024 to ~300 GW by 2050, and suggests pathways to achieve this goal. The US Department of Energy has also implemented several projects to accelerate the development of uranium enrichment and conversion capacity in the US. These initiatives are very positive for a resurgence of nuclear power in the US.
- Nuclear power uprates. Nuclear power plant power uprates have increased dramatically in the US and globally. These are modifications made to existing nuclear power plants to increase their generating capacity over the expected lifetime of the reactor.
- Russian ban on export of enriched uranium. Around 27 per cent of US enriched uranium imports in 2023 came from Russia. While US utilities probably had enough fuel for this year, and there is no immediate danger of plants shutting down due to lack of fuel, their cover will fall off substantially in four years’ time. US utilities will have to commence contracting discussions in 2025 to secure uranium, considering with the restriction of Russian uranium imports into the US coming into place at the end of 2027,” they said.
- Price of enriched uranium. The price of enriched uranium fuel for nuclear reactors has surged to a record high as demand from artificial intelligence data centers exacerbates a squeeze on the market following Russia’s invasion of Ukraine. Prices for enriched uranium have hit $190 per separative work unit — the standard measure of the effort required to separate isotopes of uranium — compared with $56 three years ago, according to data provider UxC. This will inevitably put pressure on the Uranium spot price in 2025.
- Lack of conversion and enrichment capacity in the west. There is currently no enough conversion and enrichment capacity in the west. There is only one conversion facility in the US, located at Metropolis, Illinois and operated by Honeywell Corporation. There are three enrichment facilities in the US 1) Urenco, in New Mexico; 2) Centrus Energy, located in Piketon, Ohio, and; 3) Global Laser Enrichment (GLE), which owns a laser separation enrichment facility in Wilmington, North Carolina. The Grossmeister uranium fund owns Centrus and GLE (as part of Cameco) in its portfolio. The lack of conversion and enrichment capacity has put pressure on the industry to find new facilities that can convert uranium into the pellets that go into nuclear reactors.
Portfolio Performance 4Q 2024
The Grossmeister uranium portfolio declined from an index value of 93.00 on Oct 1, 2024, to 84.18 on Dec 31, 2024-- a decline of 9.4%. This compares favorably with the decline of 11% in the uranium spot price for the same time period. The decline was mitigated by the purchase of some timely put options in Cameco on Cameco, resulting in a 100% gain when closed on December 18. In addition, we conserved cash in this period of declining spot prices and low LT contract price movement, in anticipation of a more favorable market environment starting in 2025. So far, our projection for a more favorable market in 2025 has been confirmed by an increase in the Grossmeister uranium portfolio of 12% as of January 22 , 2025.
The best performer in the portfolio for 4Q was Denison Mines (DNN), which advanced 14%, and then Centrus Energy (LEU) , which advanced 11.3%. This was followed by Cameco (CCJ) at 5.8%. The worst performer in the portfolio was enCore Energy (EU) at -17%, followed by Energy Fuels (UUUU) at -8.2%.
Uranium Price Outlook for 2025
With so many positives building for uranium, as noted above, we expect the price of the commodity to rise back into triple-digits in 2025. The consensus among the experts is that the spot prices will need to catch up with enrichment, conversion prices, as well as long term contract prices. The rise of the need for SMRs and traditional nuclear power plants to provide 24/7 power for AI data centers is one of the key drivers for a uranium spot price increase in 2025. Some analysts believe that uranium prices of $150 to $200 are possible within the next few years. Geopolitical tensions, and reduced production from the world’s largest uranium miner, Kazakhstan’s Kazatomprom, are also anticipated to play a key role in uranium market dynamics in 2025.
In the US, the Biden administration's Russian uranium ban will continue to be a factor in the country's supply and demand story. In 2023, the US purchased 51.6 million pounds of uranium, with 12 percent supplied by Russia. In response to the Russian uranium ban and other sanctions stemming from the Russian invasion of Ukraine, the Kremlin levied its own enriched uranium export ban on the US in November. With a potential shortfall of 6.92 million pounds looming for the US in 2025, strategic partnerships with allies will be crucial, as well as increased M&A activity in the uranium space.
On the US political front, the incoming Trump administration has announced strong support for nuclear power, with the appointment of Chris Wright as Energy Secretary, former CEO of Liberty Energy, a Denver-based oil field services company. Mr. Wright has committed to growing the US electrical grid, and increasing oil/gas and uranium production in the US.
The increased demand for uranium means that western utilities will need to scramble to secure uranium supply, and the limitation of available uranium supply will drive uranium prices higher. The biggest beneficiaries of this increased demand will be North American (Canada and US) uranium Tier 1 and 2 miners, with Canadian miners first: Cameco (CCJ), Denison Mines (DNN), and NextGen (NXE). Then secondly, some of the US miners which are ramping up previously producing mines, are expected to add significantly to uranium supply: Uranium Energy Corporation (UEC), Energy Fuels (UUUU), ISO Energy (ISENF), and UR-Energy (URG). All of these miners are well positioned in our portfolio, and we are confident they will provide sustained price increases in 2025. In our opinion, 2025 shapes up to be a good year for the uranium market, and we continue to believe we are still in the early stages of a uranium bull market.
The information on this website is for informational purposes only and is not investment advice or a recommendation to buy, sell, or hold any securities. Always consult a qualified financial advisor to discuss your investment objectives and risk tolerance before making any investment decisions. We do not guarantee the accuracy, completeness, or timeliness of the information provided. Past performance is not indicative of future results, and investing involves risks, including the potential loss of principal. By using this website, you agree not to hold the authors, owners, or contributors liable for any decisions made based on the information provided. For personalized advice, please consult a professional financial advisor.
Schlüsselindikatoren
| Rendite | 49,35% |
| Volatilität p,a, | 41,81% |
| Maximum Drawdown | -46,86% |
| Barbetrag | 7,31% |
| Anzahl Positionen | 23 |
| Sharpe Ratio | 0,31 |
| Sortino Ratio | 0,46 |
Historische Grafik
| Daten für den letzten Monat | Für das Halbjahr | Für das Jahr | Seit dem Start |
|---|---|---|---|
| -15,69% | -17,03% | +8,87% | +15,40% |
Aktuelle Transaktionsbeispiele
| Instrument | GuV | Typ der Transaktion | Währung | Preis | Datum |
|---|---|---|---|---|---|
| Energy Fuels | Каuf | USD | 21,53 | 17.04.26 | |
| Cameco | Каuf | USD | 112,98 | 01.04.26 | |
| Skyharbour Resources | Каuf | CAD | 0,42 | 24.03.26 |
Kontakte
Nuclear and renewable resource strategy follow the link to learn more